How to Analyze a Credit Card Statement (Categories + Charts)
Zedly AI Editorial TeamJanuary 29, 20269 min read
Most people only see credit card spending as a long list of transactions. Scrolling through pages of charges, trying to spot patterns or problem areas, is tedious and rarely leads to action.
A simple chart changes everything. It instantly shows where your money goes and where you can cut back. You do not need to wait for monthly PDF statements or copy data by hand.
The fastest path: export transactions as a CSV, feed it to an AI analyzer, and get categorized charts in seconds.
Most Credit Card Companies Let You Download Transactions as CSV
This is the tip most people miss. Banks and credit card issuers spend resources building visual dashboards, but those dashboards group transactions by generic categories like "Shopping" or "Travel." That tells you very little about your actual spending patterns.
The better approach: download your raw transaction data as a CSV file.
Why CSV Beats Monthly PDFs
Already structured: CSV files have clean columns (date, merchant, amount) with no parsing errors
No monthly friction: Export any date range you want, not just the billing cycle
Combine multiple months: Download a year of data in one export and analyze trends over time
Many issuers let you export custom date ranges: last 30 days, 90 days, year-to-date, or any timeframe you choose. Export formats often include CSV, Excel, QBO/QFX, and sometimes OFX.
How to Export Your Transactions
Log in to your credit card account online
Navigate to Transactions or Activity
Filter or select your desired date range
Look for Download, Export, or a download icon
Choose CSV format (or Excel if CSV is not available)
Chase, American Express, Capital One, Citi, and most major issuers support CSV exports. The option is usually near the search or filter controls on your transaction history page.
AI to Analyze Credit Card Statements
A CSV gives you structured data, but you still need to make sense of it. Spreadsheet pivot tables and manual formulas work, yet they demand time and expertise most people do not have. AI removes that barrier entirely.
When you feed a credit card CSV to an AI analyzer, the system reads every row, identifies the relevant columns, and builds charts or summaries on demand. You describe what you want in plain English ("show my top spending categories this quarter") and get a result in seconds. No formulas, no conditional formatting, no VLOOKUP chains.
The biggest advantage is intelligent category grouping. Banks assign each transaction a merchant category code (MCC), but those codes are broad and often misleading. A coffee shop and a furniture store can both land under "Retail." AI looks at the actual merchant name and groups transactions into categories that reflect your real spending: dining, groceries, subscriptions, travel, utilities, and so on.
AI also handles merchant normalization automatically. The same retailer might appear as "AMZN," "Amazon.com," "AMAZON MARKETPLACE," and "AMZ*Digital" across different statements. Instead of treating those as four separate vendors, the system consolidates them into a single entry so your totals and charts are accurate.
Beyond grouping, AI catches patterns that are hard to spot in a list of transactions:
Recurring charges: Subscriptions and memberships that quietly add up month after month
Spending spikes: Unusual increases in a category compared to your typical baseline
Trend lines: Whether your overall spending is climbing, flat, or declining over time
All of this happens without sending your data to a model that trains on it. Zedly processes files in an isolated environment with strict retention controls, so your financial information stays private. The same approach works for bank statement analysis if you want to combine checking account data with your credit card transactions.
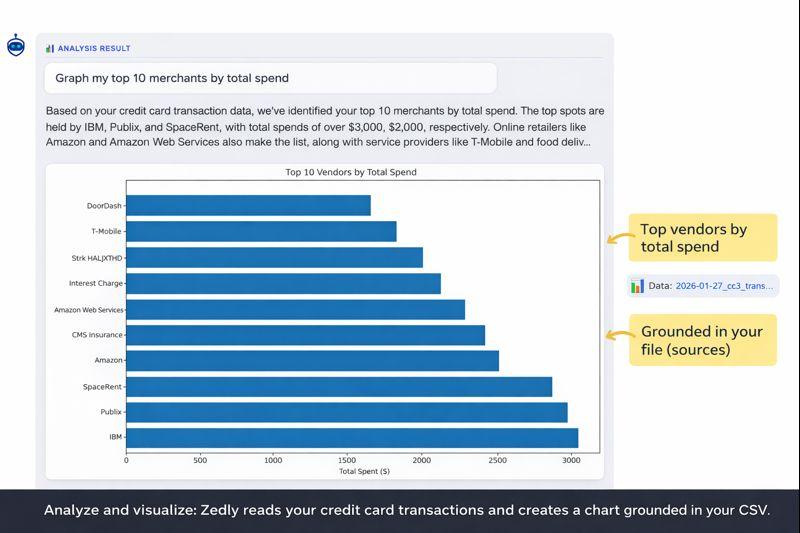
Graph Your Top Merchants by Total Spend
Once you have a CSV, you can generate a chart in seconds. Here is what that looks like:
Example: A single prompt generates a bar chart and shows the exact source file used.
This chart immediately reveals:
Top 10 vendors by total spend: See at a glance where your money goes
Recurring high-spend merchants: Subscriptions, delivery apps, and services you might have forgotten about
Data source verification: Zedly shows the source file beside the result so you can trust the output
No formulas. No pivot tables. Just upload the CSV and describe what you want to see. For merchant-level anomaly drivers and spend cube analysis on larger datasets, see AI spend anomaly detection from Excel.
Step 1: Export Your Transactions to CSV
Choose a date range that matches what you want to analyze:
Last 90 days: Great for spotting recent changes or new subscriptions
Year-to-date: Useful for budget planning and tax prep
Last 12 months: Best for seeing seasonal patterns and long-term trends
If you want to compare year-over-year, download the same period from the previous year as a separate file.
Step 2: Upload the CSV
Upload your exported CSV file into your analysis tool. In Zedly, you can drag and drop the file onto your workspace.
A quick note on privacy: credit card transactions contain sensitive financial data. Zedly processes files in an isolated environment with strict retention controls. Your data is never used to train AI models, and you control when files are deleted.
Step 3: Use a Simple Prompt
Describe what you want to see in plain English. Here are five prompts you can copy and paste:
"Graph my top 10 merchants by total spend."
"Group transactions by merchant and show a bar chart."
"Show monthly spend trend for the last 12 months."
"Show top categories by total spend (and list which merchants are in each)."
"Flag subscriptions/recurring charges and graph them."
The system reads your CSV, identifies the relevant columns, and generates the chart. You can iterate by asking follow-up questions like "now show just the last 30 days" or "exclude refunds."
5 Charts That Actually Change Behavior
Once you have the basics working, try these visualizations that tend to drive real spending changes:
Monthly spending trend (line chart): See if your spending is creeping up over time or staying stable
Top categories (bar chart): Understand the big buckets: dining, subscriptions, shopping, travel
Subscriptions over time (line or stacked bar): Track how recurring charges have grown month over month
Largest single transactions (table + bar): Spot one-time purchases that made a big dent
Merchant drill-down (one merchant over time): Pick a specific vendor (like Amazon or DoorDash) and see your spend history with just that merchant
Each of these gives you a different lens on the same data. The monthly trend shows trajectory; the merchant drill-down shows habits.
Store Statements in Your Vault for Tax Season
Here is something that solves a real frustration: by storing your credit card statements in your private vault, you can fetch them later for reference without digging through email or re-downloading from your bank's portal.
Every year, tax season arrives and you need to find that one statement from March, or pull together all your business expenses from Q3. The typical workflow is painful:
Log into each credit card account
Navigate to archived statements (if they even keep them past 12 months)
Download PDFs one by one
Repeat for every card and every month you need
With a private vault, you upload statements once and they stay organized and searchable. When tax time comes, your data is already there. Ask questions like "show all business expenses over $500 from last year" and get answers instantly, with the source statements linked for verification.
You can also save the full analysis session for later retrieval. Name it something like "Card spend for 2024" and come back to it months later with all your charts, prompts, and results intact. No need to re-upload files or re-run queries.
The vault also means you are not relying on your bank's retention policies. Some issuers only keep 18 months of history online. If you need older data, you are out of luck unless you saved it yourself.
If Your CSV Is Messy: Common Issues and Fixes
Real-world credit card exports are not always clean. Here are the most common problems and how to handle them:
Duplicates (Pending vs Posted)
Some exports include both pending and posted versions of the same transaction. Ask the system to "remove duplicate transactions" or "keep only posted transactions" before charting.
Refunds and Reversals
Refunds show as negative amounts. If you want net spend, the system will automatically subtract refunds. If you want gross spend only, ask to "exclude refunds and credits."
Merchant Naming Inconsistencies
The same merchant might appear under several variations ("AMZN," "Amazon.com," "AMAZON MARKETPLACE"). As noted in the AI section above, an AI analyzer consolidates these automatically. If you are using a spreadsheet instead, ask the system to "normalize merchant names" before charting.
Multiple Cards or Accounts in One Export
If your export includes multiple cards, filter by card number or account, or ask to "show spending by card" to compare them.
Time Zones and Date Confusion
Posting date vs transaction date can differ by a day or two. For monthly charts, this rarely matters. For daily analysis, specify which date column to use.
Frequently Asked Questions
Can I graph credit card debt with this?
You can graph spending from transaction data. Debt requires balance data, which some issuers include in exports. Otherwise, use statement balance snapshots and enter them manually to track debt over time.
What if my bank only provides PDFs?
Use a statement converter to extract transactions from PDF to CSV first. Then upload the CSV and generate charts. Many banks also offer CSV exports directly from their online portal if you check the Activity or Transactions section.
Is it safe to upload financial files?
With Zedly, your files are processed in an isolated environment with strict retention controls. The system shows you exactly which source file was used for each result, so you can verify the output. Your data is never used for model training. See our privacy policy for details.
Ready to Analyze Your Credit Card Spending?
Upload your CSV and let AI categorize transactions, normalize merchants, and generate charts in seconds. No spreadsheet formulas, no manual data entry.