← Back to Blog
Agentic Security
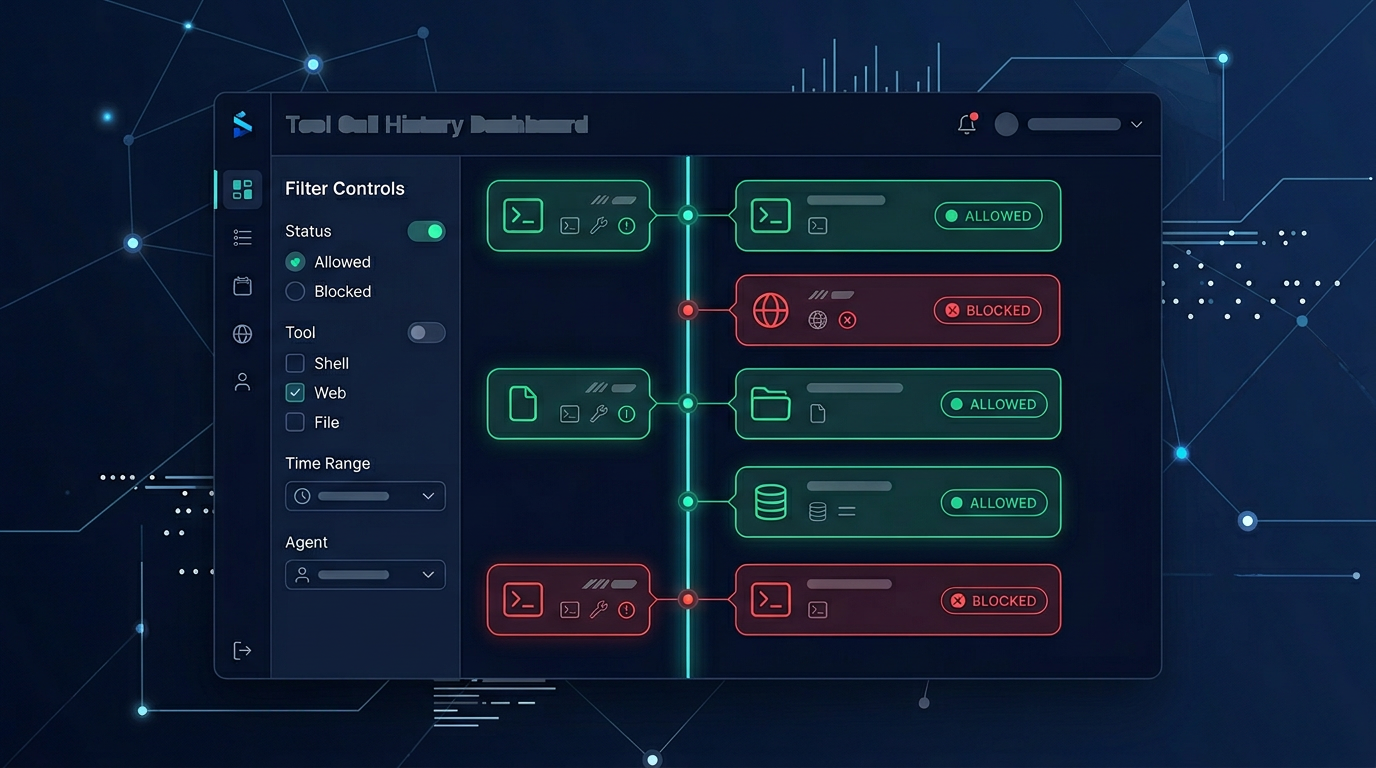
OpenClaw Tool Call History Dashboard: See What Your Agents are Doing
Zedly AI Editorial Team
March 15, 2026
10 min read
OpenClaw agents call dozens of tools per session: exec, read, write, browser, memory_search, and more. Each tool call is a decision the agent made, and each decision has consequences. A file was read, a command was run, a web page was visited. The built-in session viewer shows these calls embedded in conversation context, which is useful for understanding why the agent made a call, but not ideal for answering operational questions like "how many exec calls ran today?" or "which sessions accessed production config files?"
This article describes how to build a purpose-built tool call history dashboard: a flat, filterable, searchable timeline of every tool invocation across all sessions, with the context you need for debugging, security review, and optimization.
Why Tool Call Visibility Matters
Three audiences benefit from a dedicated tool call history view, each with different questions:
Debugging
When an agent produces unexpected output or fails silently, the tool call sequence is the diagnostic trail. Which files did it read? What commands did it run? Did a tool return an error that the agent handled incorrectly? The conversation history shows the agent's reasoning; the tool call history shows what actually happened.
Security review
Security teams need to answer questions like: "Has any agent accessed files outside its designated workspace?" "Were there any exec calls with network access (curl, wget, ssh)?" "Did any session exhibit an unusual tool call pattern that suggests prompt injection?" These questions require a flat, searchable index of tool calls, not a per-session conversation view.
Optimization
Tool calls have costs: execution time, API calls, compute resources. A dashboard that shows tool call frequency by type, average execution time, and patterns over time lets engineering teams identify optimization opportunities. Is the agent calling read on the same file multiple times? Is a cron job making redundant API calls? These patterns are visible in aggregate but invisible in individual session views.
What OpenClaw Provides Today
OpenClaw offers several mechanisms for viewing tool call activity, but each is optimized for a different use case:
- sessions_history: returns the full conversation including tool calls and results. Suitable for replaying a specific session, but returns too much data for aggregate analysis and requires a session ID as input.
- sessions.tools: lists tools used within a session. Useful for a quick summary, but does not include timestamps, arguments, or invocation order.
- Desktop UI: shows conversation threads with tool calls inline. Good for interactive debugging, but does not support cross-session search or filtering.
- Community dashboards: several open-source projects on GitHub offer alternative UIs for OpenClaw, including some that display tool call activity. These typically require self-hosting, have limited filtering capabilities, and do not integrate with security policy or audit log data.
The common gap: none of these provide a cross-session, flat, filterable timeline of tool calls with security context (policy decisions, redaction events) layered on top.
What a Good Tool Call Dashboard Shows
The dashboard should answer questions at three levels of detail:
Overview level
- Total tool calls in the selected time range
- Breakdown by tool type (exec, read, write, browser, memory, etc.)
- Count of blocked calls vs. allowed calls
- Count of calls where PII redaction was applied
Timeline level
- Chronological list of every tool call with: timestamp, tool name, sanitized arguments, session ID, and action (allow/block/redact)
- Filters by tool type, action, session ID, time range, and keyword search on arguments
- Visual indicators distinguishing allowed calls, blocked calls, and redacted calls
Detail level
- Full event data for a single tool call: all schema fields, policy rules that matched, and the hash chain link
- Session context: link to the run view for the session this tool call belongs to
- Adjacent events: what happened immediately before and after this tool call in the same session
Building a Tool Call Timeline from Events
If you are building on top of a tool call audit log, the dashboard is a rendering layer on top of an existing event stream. The implementation has three components:
1. Indexing
Load events from JSONL (or receive them via the forwarding pipeline) and index them by: timestamp, tool name, session ID, action, and a full-text index on the toolPath field. SQLite with FTS5 is sufficient for single-instance deployments; a hosted search service scales to multi-instance fleets.
2. API layer
Expose a query API that supports filtering, pagination, and time-range selection. The API returns events in reverse chronological order (most recent first) with computed fields like relative timestamp ("2 minutes ago") and session type (cron vs. interactive).
3. Rendering
The frontend renders events as a scrollable timeline with color-coded action indicators, expandable detail panels, and filter controls. Infinite scroll or pagination keeps the initial load fast even with thousands of events.
The key architectural decision is whether the dashboard is a separate service or part of the plugin's forwarding target. A separate service (like a cloud dashboard) has the advantage of surviving local machine failures and aggregating data from multiple agents.
How Zedly Shield Fits
Zedly Shield's cloud dashboard provides a ready-made tool call history view:
- Event Timeline tab: a flat, filterable, searchable timeline of every tool call across all sessions. Each event shows the tool name, sanitized path, session ID, action (allow/block/redact), and timestamp. Filters support tool type, action type, session ID, and time range.
- Runs tab integration: clicking a session ID in the event timeline navigates to the Runs view for that session, showing the full run context: start time, duration, total events, and the complete tool call sequence.
- Policy overlay: tool calls that triggered policy rules (blocks, redactions) display the matched rule alongside the event. This gives security teams a single view of both the tool activity and the governance layer's response.
- Multi-instance aggregation: if you manage multiple OpenClaw deployments, events from all instances appear in a single dashboard with instance-level filtering. You can search across your entire fleet for a specific command or file path.
The dashboard is populated automatically by the Shield plugin's event forwarding pipeline. Install the plugin, configure the API key, and every tool call from that point forward appears in the dashboard. No additional infrastructure to build or maintain.
Run the OpenClaw Risk Check
See what your OpenClaw agents are actually doing. Our team will analyze your agent's tool call patterns, identify visibility gaps, and show you how a purpose-built dashboard improves debugging, security review, and operational awareness.
Explore Zedly Shield
Frequently Asked Questions
How is a tool call history dashboard different from the OpenClaw session viewer?
OpenClaw's session viewer shows conversation history as a dialogue: user messages, assistant messages, and tool results interleaved. A tool call history dashboard strips away the conversation and shows only the tool invocations, in sequence, across all sessions. Think of it as the difference between reading a transcript and reading a log. The dashboard gives you a flat, filterable, searchable stream of what the agent did, without the conversational context around it.
Can I search tool call history by command or file path?
Yes, if the event schema includes a sanitized toolPath field (which is the command string for exec, the file path for read/write, or the URL for browser tools). The dashboard can index this field for full-text search, letting you find every time the agent ran a specific command or accessed a specific file. This is particularly useful for incident investigation: 'show me every exec call that touched /etc/' is a one-query answer.
Does the dashboard show tool calls that were blocked?
Yes. Blocked tool calls (policy_block events) appear in the same timeline as allowed tool calls, with a distinct visual indicator. This is important for two reasons: it shows that the security policy is working (dangerous calls were intercepted), and it shows what the agent tried to do (which may indicate a <a href='/blog/openclaw-prompt-injection-protection'>prompt injection</a>, a misconfigured task, or a legitimate need that the policy is overly restrictive for). Injection events also appear as policy_injection entries in the same timeline.
How far back does the history go?
The retention period depends on your storage layer. The local JSONL file can be retained indefinitely (storage is cheap and the file grows slowly). The cloud dashboard retains events according to your plan's retention policy. For compliance purposes, most organizations retain 90 days to one year of tool call history, which covers audit windows for SOC 2 and most regulatory frameworks.
Can I export tool call history for external analysis?
The underlying data is structured JSON (one event per line in JSONL format), which can be loaded into any analytics tool: jq for command-line queries, pandas for Python analysis, or a data warehouse for SQL queries. The cloud dashboard also supports filtered exports. The event schema is documented and versioned, so external consumers can rely on a stable format.
Ready to get started?
Runtime safety for agentic AI. PII redaction, policy-based blocking, and tamper-evident audit logs for OpenClaw.